This post is the start of a series on how to debug Common Lisp code, specifically with Emacs, Slime, and SBCL. If you do not understand Common Lisp, you should still be able to follow along and recognize just how powerful the facilities provided by the Common Lisp debugger are. Nathan Marz asked me to write these posts since he thought many of the tools for debugging Common Lisp were pretty cool.
For the next post in the series on inspecting, click here.
The first thing you need to do in order to get started debugging Common Lisp is to set your Lisps optimization qualities. Optimization qualities are basically a group of settings which allow you to specify what the compiler should optimize for. These qualities include speed, space, compilation speed, safety, and debugging. If you do not run the code below, which tells the compiler to optimize for debugging, almost none of the examples in this post will work.
CL-USER> (declaim (optimize (debug 3)))
NIL

CL-USER> (your-program)
...
With the compiler optimized for debugging, it becomes possible to do pretty much everything at runtime. This post will show you how Tom, an experienced Lisp developer would debug and patch a buggy function at runtime. Lets say that Tom has the following code which implements the well known Fibonacci function:
(defun fib (n)
  (if (<= 0 n 1)
      (/ 1 0)
      (+ (fib (- n 1))
         (fib (- n 2)))))
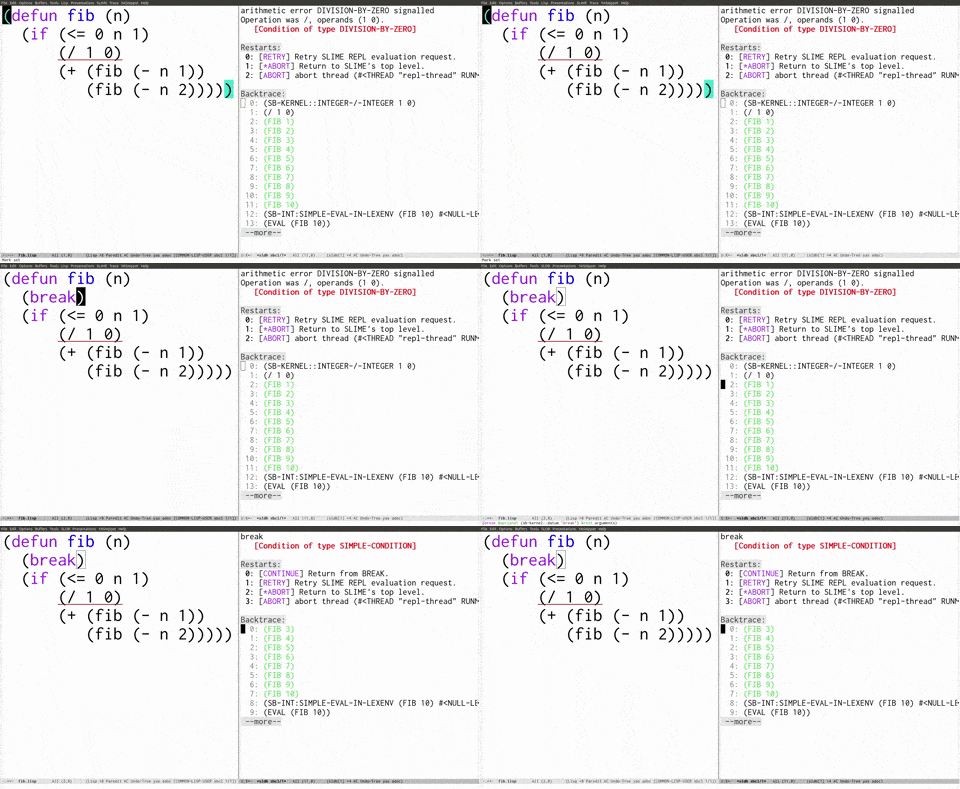
There’s just one problem, the code isn’t correct! Instead of returning n in the base case, the code winds up dividing by zero. When Tom tries to calculate the tenth Fibonacci with this code, a debugger window pops up because an error was signaled.
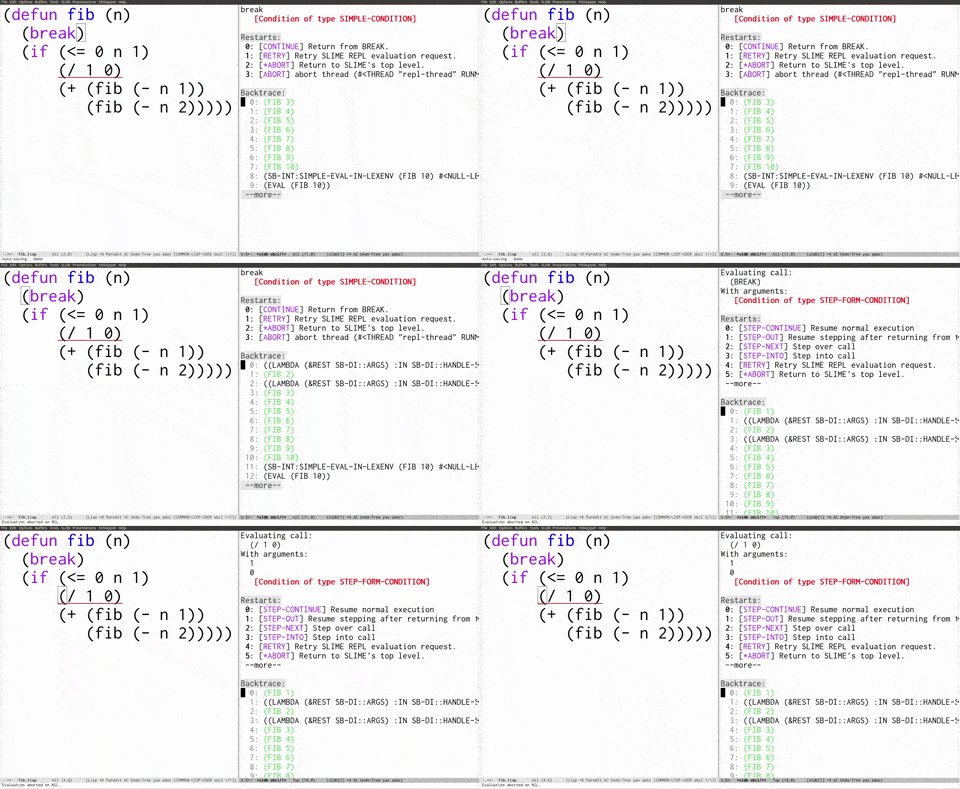
Realizing that he has entered the debugger, Tom wonders what has gone wrong. In order to find the bug, Tom decides to insert a breakpoint into the function.1 In Common Lisp, breakpoints are implemented as a function called break’.2 To insert his breakpoint, Tom adds a call to break at the beginning of fib. After adding the breakpoint, Tom then puts his cursor next to one of the frames and hits the r key in order to restart it. In this case, Tom decided to restart the frame where n was three.
By restarting the frame, Tom basically traveled back in time to the beginning of the frame he restarted. After restarting the frame, the debugger immediately hits the breakpoint Tom had just added. From there Tom steps through the code by hitting the s key. He eventually realizes that the base case is implemented incorrectly and that that is why he received the error.
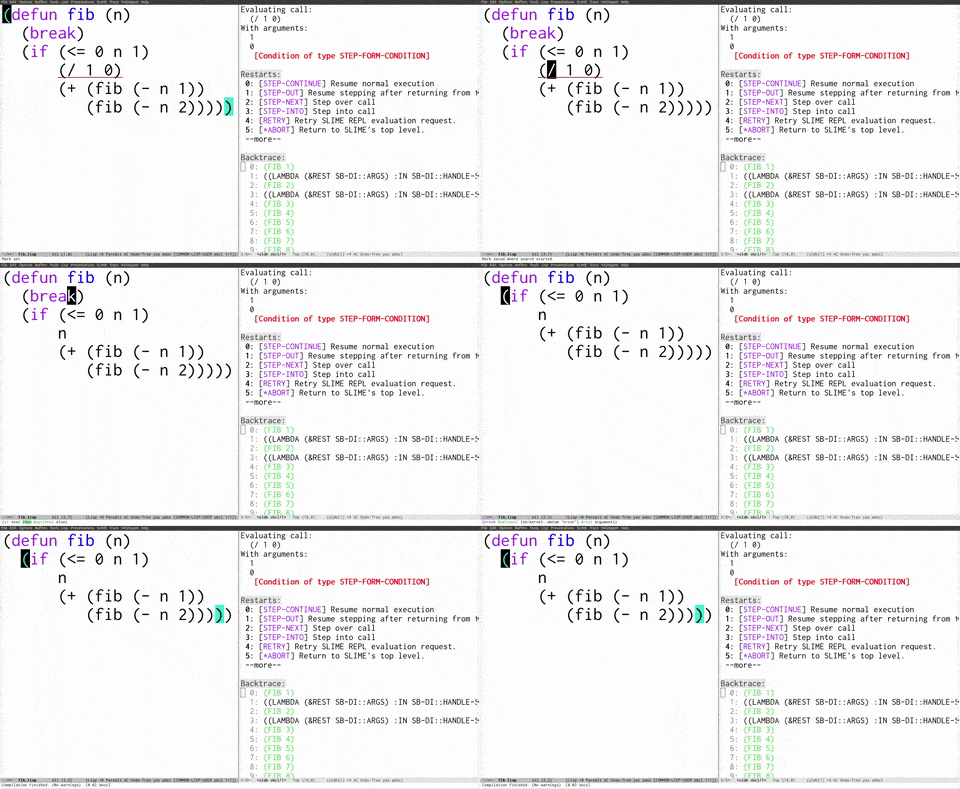
After finding the source of the problem, similar to how he had previously inserted the breakpoint, Tom patches the code. He replaces the base case with n and removes the breakpoint he had previously inserted.
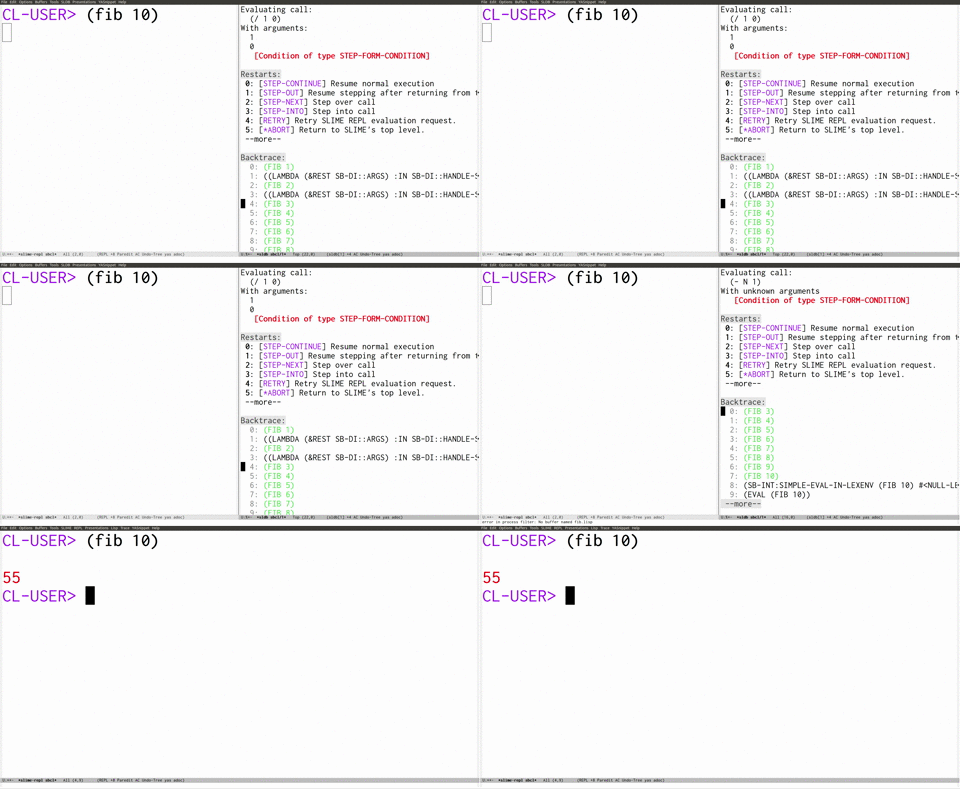
After recompiling the code, Tom once again restarts one of the frames. Since he was previously stepping through code, the debugger starts stepping through the frame Tom decided to restart. Tom just taps the 0 (zero) key in order to invoke the step-continue restart3 and continue normal execution. Because Tom restarted a frame which occurred before the bug, and now that the bug is gone, the code runs as if there had never a bug in the first place!
Lets recap what happened. After the code signaled an error, Tom found himself in the debugger. Tom was able to insert a breakpoint and poke around until he found the source of the problem. After finding the problem, Tom patched the code and restarted the process from a point before it had signaled an error. Because Tom had corrected the code, after he restarted the frame, it acted as if nothing had ever gone wrong!
The ability to recompile code at runtime is just one of the many incredible features provided by Common Lisp. Next time, I’m going to talk about the Slime inspector, which makes it possible to look into and modify objects from within debugger.


Nice tutorials! I found them when I was looking for ways to debug with SLIME. Very educational.
Very helpful tutorial!
It is really neat how in the videos when you step in the debugger with ‘s’ or ‘0’ the frame with the code highlights where you been stepping. In my emacs/slime unfortunately I don`t have this subtle but nice feature, instead I get some *slime-source* buffer which drags a noisy “***HERE***”.
Any ideas on how to boost my .emacs to cleanly hightlight the debugger like Tom’s ? :)
I’m not sure. My best guess is you are using a different version of slime than what I was using. You should ask the slime mailing list: https://mailman.common-lisp.net/listinfo/slime-devel.
Daniel: It seems to be a SBCL artifact due to an internal macro expansion. I sometimes see it with SLY also.
(Sorry for dup comment…)
It looks like a SBCL artifact, due to macro expansion or perhaps optimizations. At times I also see it. If you aren’t already doing it, try “(declaim (optimize (speed 0) (safety 3) (debug 3)))”, and try some different code, such as exactly what malisper has here.
Amazing tutorial. @Michael and @Daniel: The first time I did this, while stepping with “s”, I also got a buffer named *slime-source*, containing source code for fib, and the symbol “#:***HERE***” marking the location within it.
Later I realized that I had only evaluated the defun of fib (using C-x C-e), and I had not actually compiled my source file. When I compiled my source file with C-c C-k, I then got the code highlighting within my source file as in the example.