This post is for all of the miscellaneous features that arent large enough to get their own individual posts. If you havent read all of them, here are the links to the previous posts on recompilation, inspection, class redefinition, and restarts.
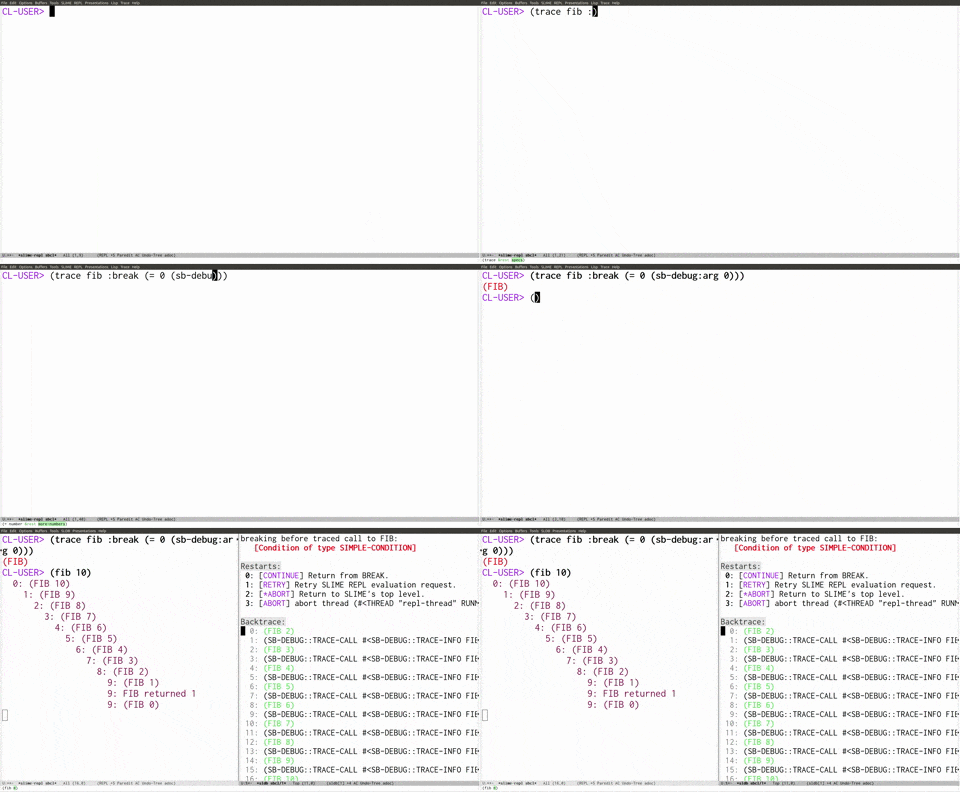
One somewhat obscure tool for debugging is SBCLs trace. SBCLs trace goes way beyond what most other implementations provide. In SBCL, trace takes several additional keyword arguments.1 For example, trace accepts a keyword argument, :break. The expression passed in as the value of :break will be evaluated every time the traced function is called. When that expression evaluates to true, the debugger will be invoked. For example if you have a Fibonacci function:
(defun fib (n)
  (if (<= 0 n 1)
      n
      (+ (fib (- n 1))
         (fib (- n 2)))))
you can use trace to break specifically when fib is called with an argument of zero:
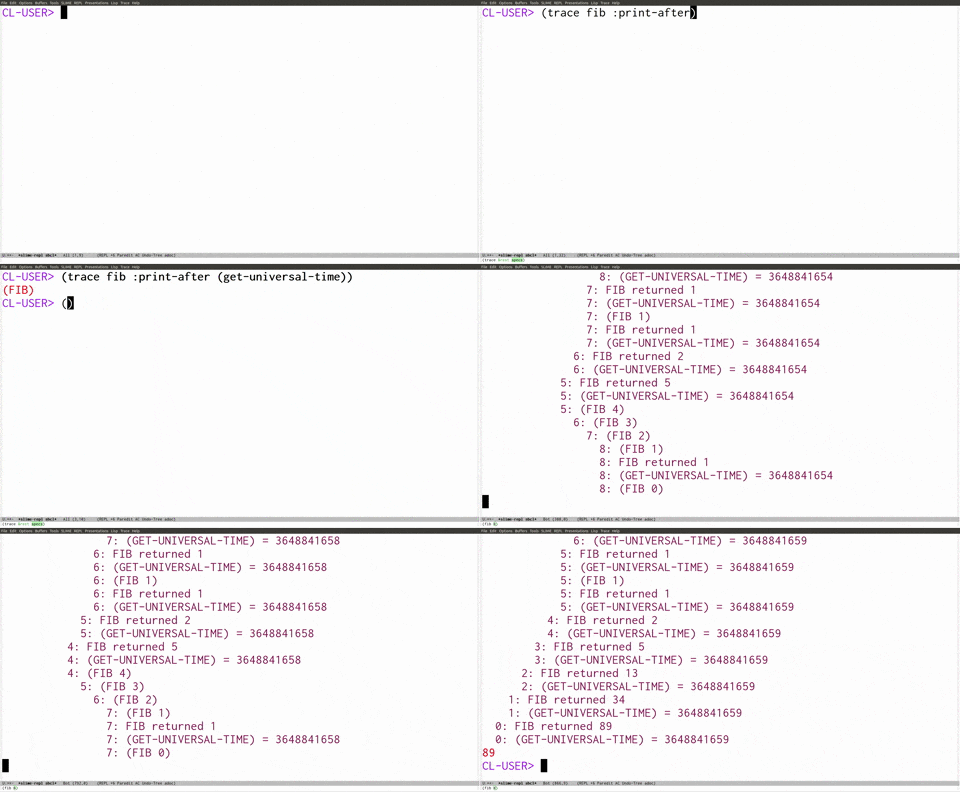
A bit of mangling has to be done (using sb-debug:arg) since the expression refers to variables within the fib function. Trace also accepts several variants of :break, such as :break-after, which evaluate the expression after the function has been called instead of before. There are also arguments :print and :print-after, which are like their break counterparts, only they print the value of the expression before/after the function is called. You could use :print-after to say, print the time (Unix time) whenever fib returns:
For a complete list of all of the arguments that trace can accept, check out this page of the SBCL manual.
Another relatively unknown group of features are the cross referencing commands. The cross referencing commands are commands which lookup all of the places where something is referenced. All of the bindings for the cross referencing commands begin with C-c C-w.2 The cross referencing command I find myself using the most, slime-who-calls, which is bound to C-c C-w C-c, shows you all of the places where a function is called from. Here is what it would look like if you were to lookup all of the places where the scan function is used in cl-ppcre and then scroll through them:3
Slime-who-calls makes it easy to figure out how a function is supposed be used. You can pull up all of the usages of a function and just look at them. There are also several analogs of slime-who-calls. There is slime-who-macroexpands (C-c C-w RET), which pulls up all of the places where a macro is used and there is also slime-who-references (C-C C-w C-r) which is the same thing only for variables.
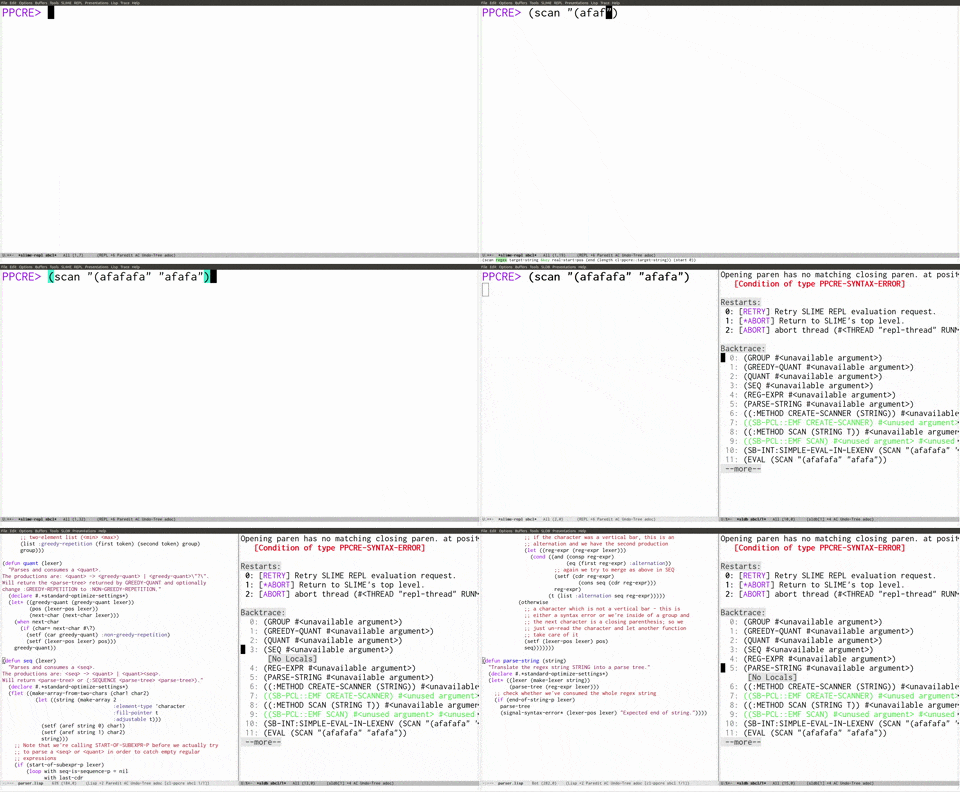
Another important feature is how to pull up the source code of a function on the stack while inside of the debugger. One way to do it is to press the v key with the cursor on the frame you want to view the source of. An alternative option is to use M-p (the alt key and the p key at the same time) and M-n to move up and down the stack frame. When using these commands instead of the normal C-p and C-n for movement, Slime will automatically pull up the source code as you are moving through the stack. Here is what it would look like if you were to pass a malformed regular expression to cl-ppcre (so that an error will be signaled and you will enter the debugger), and then scroll through the stack trace using M-n:
And now for the most common of all IDE commands, jumping to source. I was recently talking with someone and he mentioned that the only feature he uses an IDE for is to easily find definitions in source code. In Emacs with Slime, it is possible to jump to the source of pretty much anything by hitting M-. (that is the alt key followed by a period). This command works on functions, variables, classes, and more! When you jump to the source of a generic (virtual) function, you are given a list of all of the different methods that implement that function. For example if you weret to jump to the source of create-matcher-aux (the function that does most of the work in cl-ppcre), here is what you would see:
To jump back to wherever you were previously, use M-,.
And that is everything you should need to know about debugging Common Lisp.
- A keyword argument is an optional named argument. To use a keyword argument you pass in the the name of the argument, followed by the value. By using keyword arguments, a function can accept multiple optional arguments of which any subset can be used.
- C-c is pressed because that is the binding Slime uses. C-w is pressed for “who”, which is binding for all of the cross referencing commands.
- All of the places that use a macro whose expansion uses the function being cross referenced will also be pulled up.


> M-. (that is the control key followed by a period).
Shouldn’t “control” be “meta” above?
Yes, fixed.