This is part 2 of Debugging Lisp. If you haven’t read part 1 on dynamic recompilation, you can find it here. For the next post in the series on redefining classes, click here.
In this post I am going to discuss another tool used for debugging Common Lisp the Slime Inspector. The Slime inspector makes it possible to manipulate objects directly from the repl. You can do many different things with it, including clicking on objects to look at their contents and being able to copy and paste objects in order to reuse them in future function calls.1 Lets say you have the following point class:
(defclass point ()
  ((x :accessor point-x :initarg :x :initform 0)
   (y :accessor point-y :initarg :y :initform 0)))
If you were to make an instance of the above class:
(make-instance 'point :x 10 :y 20)
You can then right click on it and click on the inspect option, or just use the Emacs shortcut C-c C-v TAB to peek inside the object:
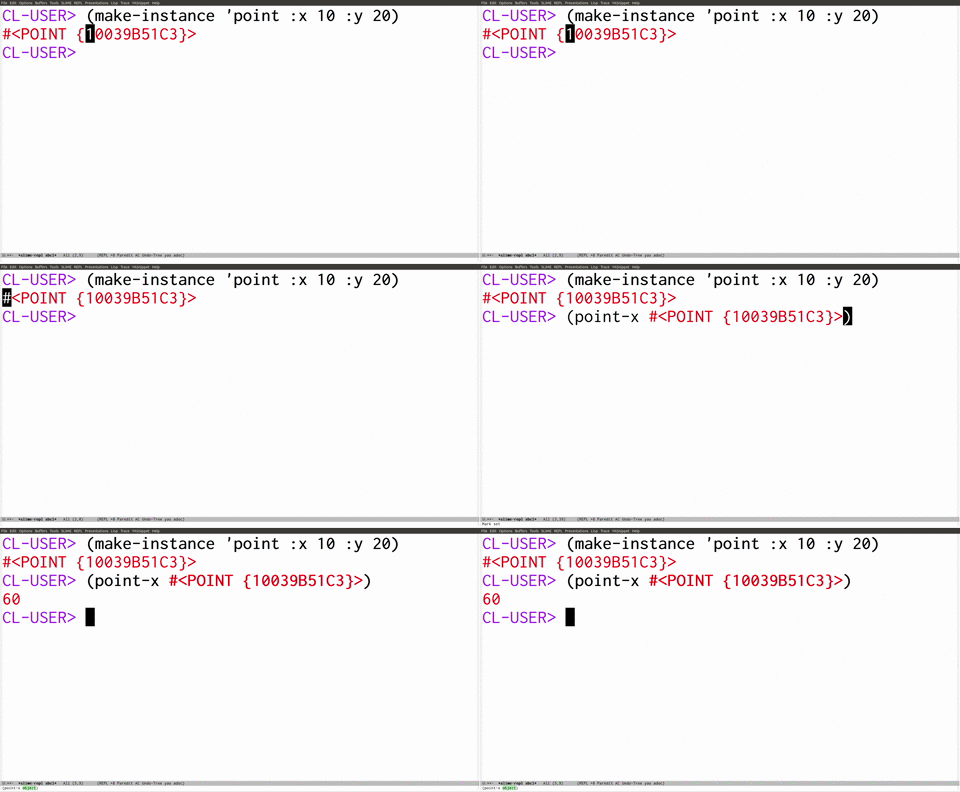
This will show you the current values of all of the instance variables of the object. Not only can you look at the objects instance variables, you can modify them as well. Note that the power comes from being able to do all of this from within the debugger at runtime.
To make sure that the value of that object was actually changed, you can copy and paste the point object and then call the point-x function on it.
One more really cool tool that hooks into the Inspector is the Slime Trace Dialog. The Slime Trace Dialog is like ordinary trace, but it also allows for inspection on the objects that were passed to or returned from the traced functions. For example, lets say you are writing a tail call optimized function, sum, that sums all of the numbers in a list.
(defun sum (xs &optional (acc 0))
  (if (null xs)
      acc
      (sum (cdr xs) (+ (car xs) acc))))

(sum '(1 2 3))
=> 6
You can toggle the use the Slime Trace Dialog to trace sum by typing the shortcut C-c M-t and then typing in the name of function, sum”. After tracing it and running the code, you can press C-c T to enter the interactive Trace Dialog buffer. From there you can press G to refresh it and obtain the most recent trace.
The trace will look like the output from ordinary trace, except it will have some addition goodies. As I said above you can inspect all of the arguments and return values. You can also hide/show branches of the trace tree in order to make it easier to find what you are looking for.
The Slime Trace Dialog is invaluable when you have code which is passing lots of objects around and you aren’t exactly sure what the value of each variable in each object is. You can just use the Slime Trace Dialog and have it keep track of all of the information for you.
All in all, the Slime Inspector is another amazing part of the Common Lisp debugging tool set. It comes in handy when the program crashes and you are unaware of the current state of the program. When combined with the rest of the features for debugging Common Lisp, the Slime Inspector is just incredible.


Hello,
First of all, thank you for this series! It has been helpful in learning some practical things.
I am writing to mention that there are parts that are unclear. It particular, you seem to have omitted some keyboard shortcuts for performing key steps.
For instance, it is unclear how to do this. The gif has too low of a resolution to see the commands.
“This will show you the current values of all of the instance variables of the object. Not only can you look at the objects instance variables, you can modify them as well. Note that the power comes from being able to do all of this from within the debugger at runtime.”
That was specifically in reference to
C-c C-v TAB, which was mentioned before the gif.Hi, I returned to this series after a while because I wanted to recomend it to somebody but I noticed that a couple of the “Screen Captures” were replaced by an unrelated capture (probably from other post about PPCRE). I was wondering if there was any way to correct that.
I was just using PPCRE as an example of what the inspector allows you to do. The recordings are as intended.
Not only can you look at the objects instance variables, you can modify them as well.
I think it must be explained in second gif . But I don’t understand how i can modify it. On third gif , i only get same output 10 with copying and pasting.